Why We Built Opservo: 40 Production Servers, 30 Companies, no SRE

Softuvo is a development agency. We build and host software for about thirty companies, which means we run a little over forty production Linux servers: Laravel and WordPress sites, Node services, Docker hosts, nginx, MySQL, Redis, spread across AWS and a few VPS providers. We do not have a site reliability engineer. We have developers who are good at their jobs and who also, in the gaps, look after servers.
For years that worked the way it works at most agencies. Something breaks, a client messages us, someone SSHes in, runs htop and df -h, reads the last hundred lines of a log, and fixes it. The fix is usually simple. Finding it is not. The hard part was never knowing that a server was in trouble. It was understanding why, and deciding what to do next, at 2 a.m., on a box you last touched six months ago.
What we tried first
We tried the tools everyone tries. Uptime checks told us a site was down and nothing else. Grafana gave us beautiful dashboards that nobody looked at until after the outage, and alert thresholds that were wrong for the next server. Datadog was built for teams whose job is observability, at a price that assumed we had one. Every tool showed us that the CPU was high. None of them said "nginx stopped rotating its logs and /var fills up in six days, run this."
Two nights from last month
I will give you two real examples from September, because they are exactly the problem.
On 19 September a workstation in our office lost its disk. The kernel remounted the filesystem read-only just after midnight. Opservo, which by then was running on that machine, raised a critical alert within the minute and about twenty-five more over the following days as the drive logged I/O errors. Nobody saw them. That workspace had no notification channel configured, so the alerts sat in a dashboard nobody had open. The detection was right; the delivery was missing. We shipped three things in the week that followed: a single composite "this disk is failing" alert instead of a pile of log-noise alerts, a red banner that will not go away while a workspace has critical alerts and no channel, and SMART raw counters so a reallocated-sector count of one is a warning, not "ok".
The second one is worse, and it is on us. Our own company workspace had been sending alerts to a Discord webhook since July. Discord had been rejecting every one of them with a 400 error since 31 July. For eight weeks, including an eight-day outage of one of our Redis servers, every alert was generated correctly and then thrown away. We found it on 28 September. The fix took a day; every channel now records the result of its last delivery, and a failing channel is itself an alert. We are telling you this because "alerts that silently fail" is precisely the thing we sell against, and we got bitten by it ourselves.
What Opservo does differently
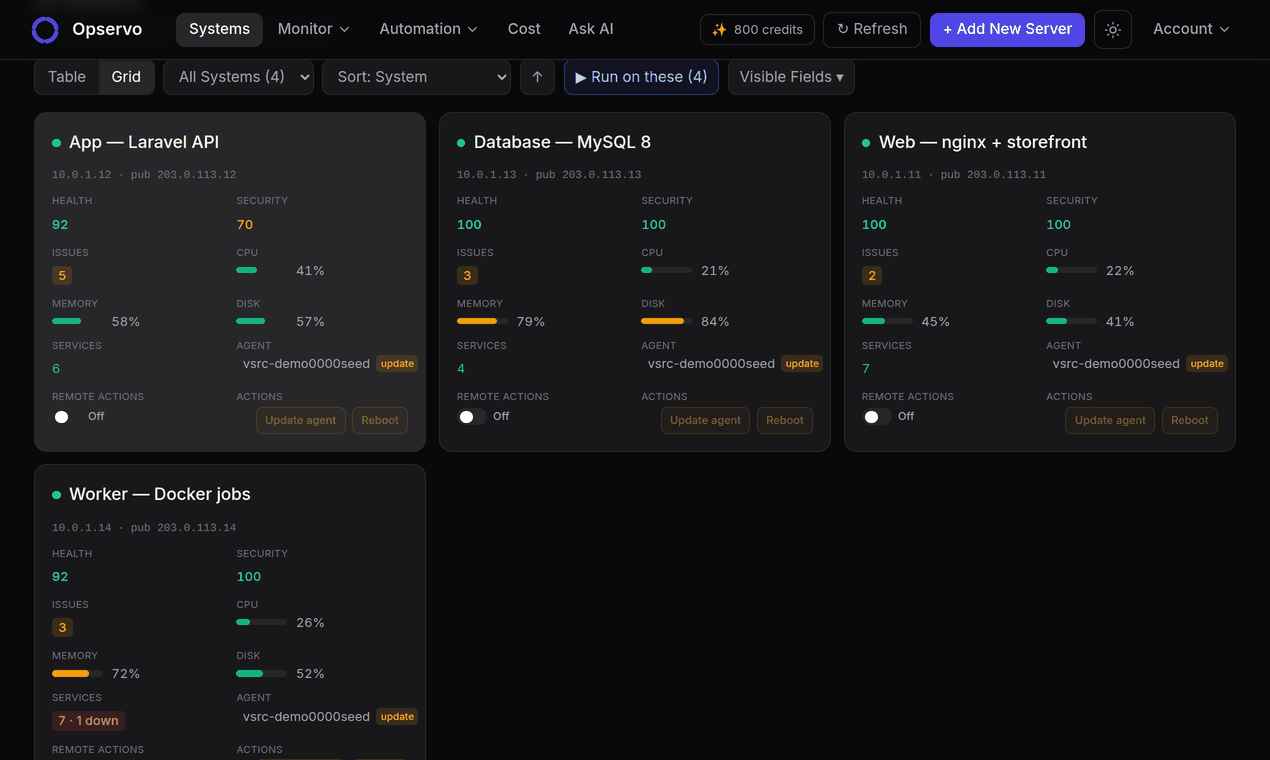
Opservo is one command per server. About thirty seconds later the agent has inventoried every service, container, domain, listening port and log source on the box. Within five minutes each server has a health score from 0 to 100, and every lost point names the rule, the threshold, the current value and the fix. When something goes wrong the explanation is a sentence, not a graph: what is wrong, what changed, what to do.
When the fix is a known one, you can approve it from the dashboard, or let a policy apply it. This is the part we were most careful about. The agent is read-only by default. It opens no inbound ports; everything is outbound HTTPS, signed. Remote actions are opt-in per server, never switched on by an update, and every command and its output is kept in an audit log. We run it on our own client servers, so those guarantees are for us as much as for anyone.
Who it is for
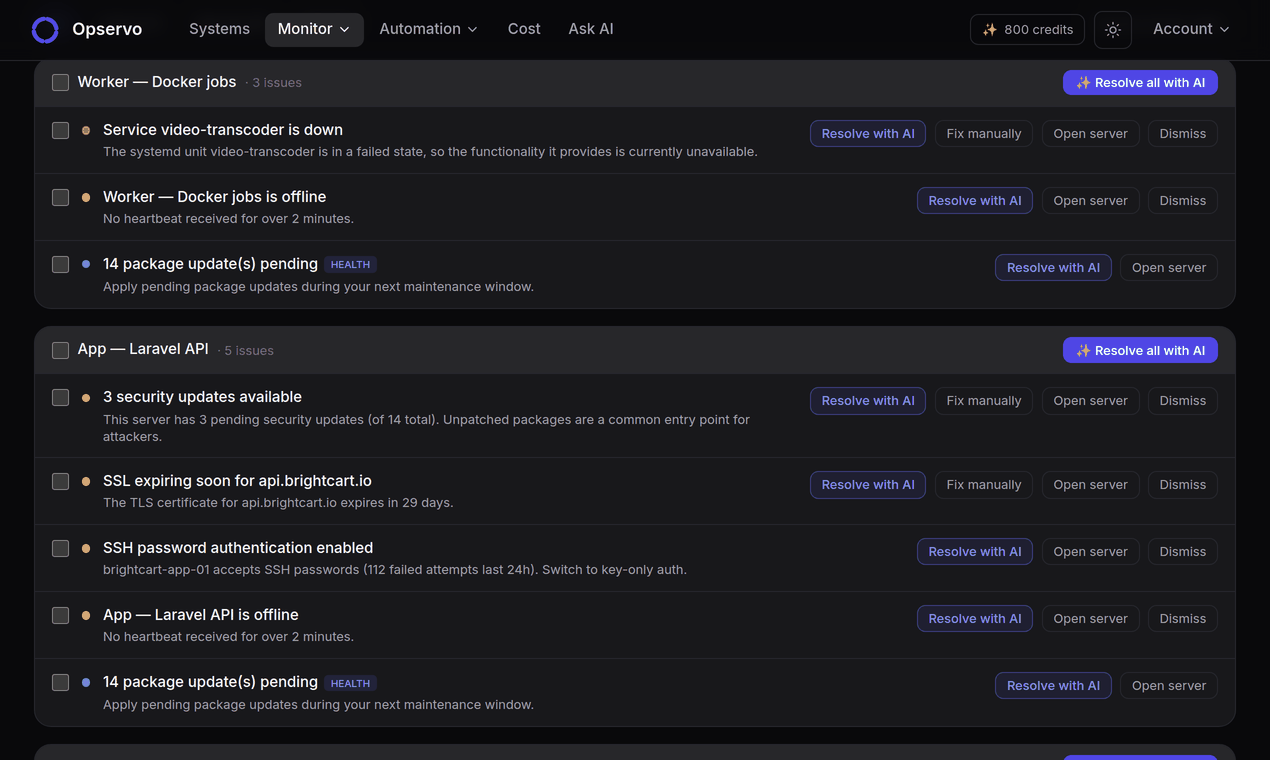
Teams like ours: agencies, small managed-service providers and small SaaS companies running somewhere between five and fifty Linux servers with nobody whose full-time job is watching them. If you have an SRE team running Datadog well, you do not need this. If you have developers doing ops on the side, you probably do.
It is free for two servers, with no card. Install it on the server that scared you last: getopservo.com. If you want the longer version of the thinking, we wrote up what server monitoring without an SRE should actually look like, and a practical guide to finding what is filling up a Linux disk, which is still the most common thing that pages us.